Interactive charts with Ruby on Rails, StimulusReflex, and ApexCharts
19 Sep 2022Every B2B web app eventually gets charts. Users love them, buyers love them, sales teams love them. Look at all this data! Look how pretty it is! Charts!
I love charts too. So, let’s build a filterable pie chart with Rails and StimulusReflex. Our chart will rely on data from the database, and, because it is 2022, we will be able to update the chart as the user applies a filter without requiring a full page turn.
To render our charts, we will use ApexCharts, but the technique shown in this article will work fine with any other frontend charting library, I just like ApexCharts.
When we are finished, we will have a Rails app with a chart that looks like this:
(It looks nicer when it isn’t being captured as a low quality gif!)
Before beginning, this article assumes that you are comfortable with Ruby on Rails and that you have a passing familiarity with Stimulus and that you have written a Stimulus controller or two before. You won’t need any prior experience with StimulusReflex to follow along with this article.
As always, you can find the completed code accompanying this article on Github.
Let’s dive in!
Setup
To skip some uninteresting configuration steps, start today by cloning this repo to your local machine, working from the main branch. Make sure you have node installed and redis running locally.
The repo comes with Rails 7 using esbuild via jsbundling-rails to bundle JavaScript, StimulusReflex installed, and two models, Job and Applicant, which will be used to provide data to the fancy chart we are going to build. Jobs and Applicants can’t be interacted with in the UI. A seed file has been provided to build enough test data for our chart to use.
From your terminal, set everything up with:
bundle install
yarn install
bin/rails dev:cache
bin/rails db:prepare db:seedAnd then boot the app and build assets with:
bin/devHead to localhost:3000 and see the beautiful “dashboard”, where the new chart will live by the end of this article.
Adding a static chart
To display our chart, we are going to use the handy ApexCharts JavaScript library. ApexCharts will handle rendering the pie chart and animating the transitions when we apply filters to the chart — we give it the data, it does the rest.
Install ApexCharts from your terminal:
yarn add apexchartsTo interact with ApexCharts we will use a Stimulus controller. From your terminal again:
rails g stimulus pie_chartHead to the generated Stimulus controller at app/javascript/controllers/pie_chart_controller.js and fill it in:
import ApplicationController from './application_controller'
import ApexCharts from "apexcharts"

export default class extends ApplicationController {
  static targets = ["chart"]

  static values = {
    labels: Array,
    series: Array
  }

  initialize() {
    this.chart = new ApexCharts(this.chartTarget, this.chartOptions);
    this.chart.render();
  }

  get chartOptions() {
    return {
      chart: {
        type: 'pie',
        height: '400px',
        width: '400px'
      },
      series: this.seriesValue,
      labels: this.labelsValue,
    }
  }
}Later in this article, this PieChartController will call a server-side reflex, so we extend this controller from the base StimulusReflex ApplicationController.
In the initialize method, we render a new ApexCharts chart, passing in the configuration options with chartOptions.
More details on the options available here can be found in the ApexCharts docs.
series and labels are set using Stimulus’ values. Stimulus values allow us to read and write HTML data attributes, providing a simple way to pass data from the server to our ApexCharts instance. Let’s connect this controller to the DOM to see how that looks in practice.
Head to app/views/dashboards/index.html.erb and update it:
<h1>Applicant Tracking System Dashboard</h1>
<div
  data-controller="pie-chart"
  data-pie-chart-labels-value="<%= @labels %>"
  data-pie-chart-series-value="<%= @series %>"
>
  <div>
    <h2>Applicants over time</h2>
  </div>
  <div data-pie-chart-target="chart"></div>
</div>Here we use the data-pie-chart-labels-value and data-pie-chart-series-value to pass in the server generated data, and then render the chart in the empty data-pie-chart-target div.
Before this will do anything but render an empty chart we need to set the values of @labels and @series in the controller action.
Update app/controllers/dashboard_controller.rb like this:
class DashboardController < ApplicationController
  def index
    data = Applicant.includes(:job).group('status').count
    @labels ||= data.keys.map(&:humanize)
    @series ||= data.values
  end
endNothing too fancy here, just Ruby. We query the database for all of the applicants grouped by the applicant’s status, which in our case will be either “active” or “inactive”.
The query returns a hash, with the status values as a the keys and the number of applicants in each status as the values, something like this:
{
  "active": 50,
  "inactive": 50
}The keys become the labels in our pie chart and the values become the series data in the pie chart.
With this change in place, refresh the dashboard and you should see the pie chart render, like this:
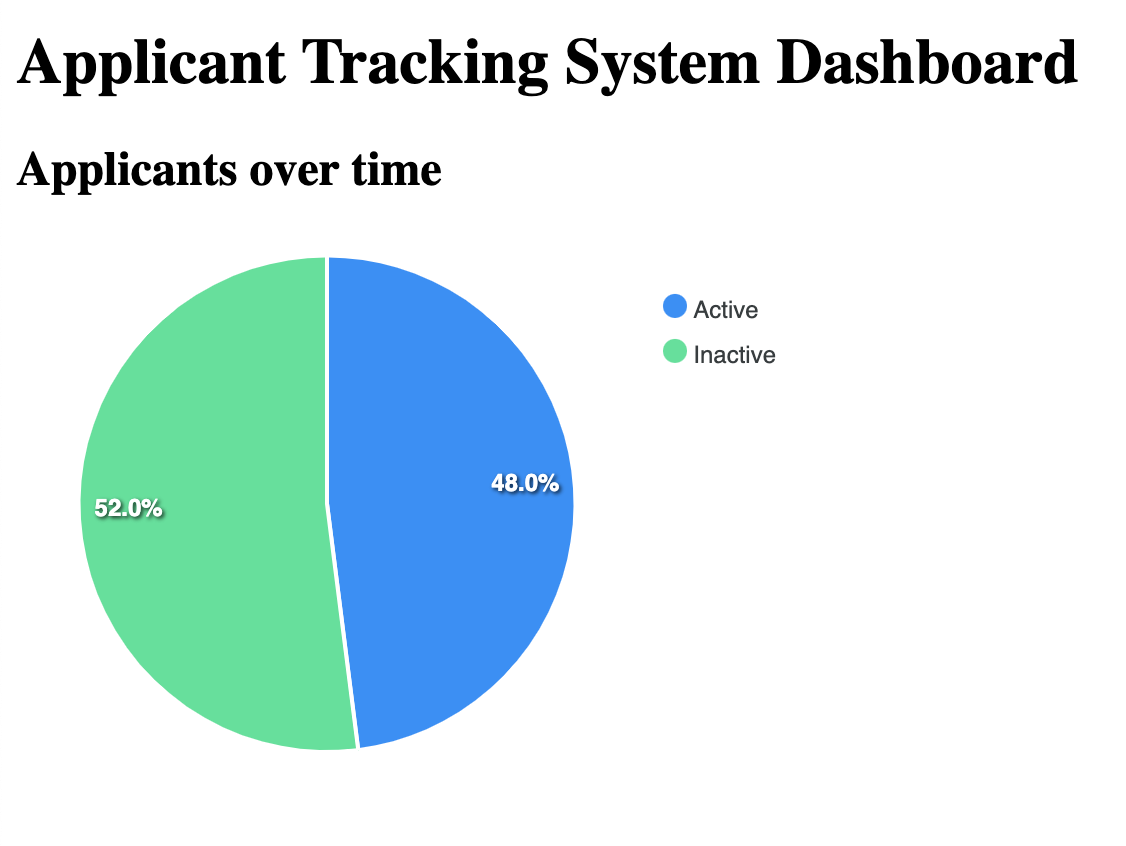
Your percentage of applicants in each status will probably be different than mine, but you should have a chart!
Right now the pie chart just shows us the status of all applicants in the database which isn’t very useful. Let’s add a filter to drill down to applicants for a specific job, applying the new results without a page turn.
Add job name filter to chart
We want users to be able to filter our chart by the name of a job posting. To do this, we will add a select input to the dashboard. When the user changes the value of the select, we will query the database for data specific to the selected job and re-render the chart with updated data.
To start, let’s add the select input to the dashboard. In app/views/dashboards/index.html.erb:
<h1>Applicant Tracking System Dashboard</h1>
<div
  data-controller="pie-chart"
  data-pie-chart-labels-value="<%= @labels %>"
  data-pie-chart-series-value="<%= @series %>"
>
  <div>
    <h2>Applicants over time</h2>
  </div>
  <form>
    <%= select_tag "job_id",
      options_for_select(
        Job.order(:name).pluck(:name, :id)
      ),
      include_blank: "All jobs",
      data: {
        action: "change->pie-chart#update"
      } %>
  </form>
  <div data-pie-chart-target="chart"></div>
</div>Note the addition of the <form> input and the select_tag that rolls up all of the jobs in the database and plucks the name and id. In a real application, we might want to be a little more selective in building the option list, but our database only has three jobs so it will be okay.
Also on the select is an associated Stimulus action. When the select changes, pie-chart#update will be called. update doesn’t exist in our Stimulus controller yet, so let’s add that now.
In app/javascript/controllers/pie_chart_controller.js add these two new methods to the controller:
update(event) {
  this.stimulate("PieChart#update", event.target, { serializeForm: true })
}

afterUpdate() {
  this.chart.updateOptions(this.chartOptions);
}Hey, StimulusReflex code! update calls this.stimulate, a method provided by StimulusReflex that we have access to in PieChartController because it extends ApplicationController.
As described in the docs, stimulate allows us to call server-side reflexes (in this case, the yet to be created PieChartReflex#update method) from our JavaScript code. Because the server needs access to the form data from the frontend, we add the serializeForm option to our stimulate call.
After the reflex runs, afterUpdate tells ApexCharts to re-render our chart with the handy updateOptions method provided by ApexCharts.
Almost there.
Before changing the job name select will do anything but generate an error, the PieChart reflex that our Stimulus controller calls must exist.
From your terminal, create the reflex:
touch app/reflexes/pie_chart_reflex.rb(In normal times, StimulusReflex provides a generator to create both a new _reflex file and the associated _controller JavaScript file. While they prepare for the official release of the next version the generator rake task is in flux, so we are not using it in this article.)
Fill that new file in:
class PieChartReflex < ApplicationReflex
  def update
    data = retrieve_data(params[:job_id])
    @labels, @series = [data.keys.map(&:humanize).to_json, data.values.to_json]
  end

  def retrieve_data(job_id)
    Applicant.includes(:job).for_job(job_id).group('status').count
  end
endAccessing the form data from the client side is as easy as params[:job_id] because of the serializeForm option in our stimulate call on the client side. Using the job id, we retrieve updated applicant details from the database and split that data out into @labels and @series instance variables.
Here the really important thing to note is that we are setting the same instance variables that the index method in the DashboardController sets. Recall that in the index method we only set the value of @labels and @series if they are not already set:
data = Applicant.includes(:job).group('status').count
@labels ||= data.keys.map(&:humanize)
@series ||= data.valuesWhen we call a reflex method, StimulusReflex reruns the current page’s controller action and renders that page’s ERB template after processing the reflex, while retaining any instance variables we have set, as described in this handy diagram from the StimulusReflex documentation.
Because we are only updating a piece of the page, we could use a selector morph instead of the default page morph. If we wanted to be really efficient, we could use a CableReady operation combined with a nothing morph to only update the two data attributes that we care about without touching anything else on the page.
For our use case, a page morph works fine. Selector and nothing morphs are more precise tools that come in handy as your pages get larger and use cases get more complex. We could also fiddle a bit with the index method in the DashboardController. When StimulusReflex reruns the index method, we make an unnecessary database call, retrieving data that we will never use. If we wanted to, we could ensure that the index method skips the data query when @labels and @series are not set, but that’s an unnecessary optimization for our tutorial.
After the reflex finishes, the afterUpdate life-cycle callback in the Stimulus controller runs which triggers ApexCharts to animate in the changes to chart.
One last step before this will work. In retrieve_data, we use a for_job scope that doesn’t exist yet.
Head over to app/models/applicant.rb to add that scope:
scope :for_job, ->(job_id) { job_id.present? ? where(job_id: job_id) : all }Now we are all set. Refresh the dashboard, change the job name input and see the chart smoothly animate in the changes to the data.
Incredible stuff.
Great work following along today, you’ve reached the end of this tutorial!
Wrapping up
Today we worked through building a filterable chart that retrieves new data from the server without requiring a page turn. To do this, we used Ruby on Rails along with Stimulus and StimulusReflex to power the chart interactivity, and ApexCharts to save us from trying to build our own chart renderer in a brief tutorial.
This is a small, simple example of what you can do with StimulusReflex and CableReady, and hopefully it provides a good idea of the simplicity and flexibility of one of my favorite libraries in Rails-land.
To learn more about StimulusReflex, the docs are the best place to start. Note that the team is nearing final release of 3.5, a long-in-the-works release that will bring with it support for installing StimulusReflex with a single command.
Until 3.5 officially releases, installing StimulusReflex into a non-webpacker Rails app requires a bit of manual work. Marco Roth’s Stimulus Reflex esbuild repo outlines the steps to get up and running manually and will be a great resource until the 3.5 release. Thanks to Marco for providing his example repo, which served as my starting point for this tutorial.
If you enjoyed this article, you might enjoy my (free) book, Hotwiring Rails, from which is article was adapted. In the book, we build a fully functional Rails 7 application from scratch, focusing on adding interactive features with Turbo, Stimulus, CableReady, StimulusReflex, and friends.
As always, thanks for reading!